
Give Meals, Grow Minds.
Join Feeding Futures PH in our mission to provide daily nutritious meals to impoverished children, fighting malnutrition and empowering their future.
Sponsor a Meal TodayThe Challenge We Face
Despite progress, the Philippines still faces a significant challenge with childhood malnutrition. The rate of stunting—a condition with irreversible effects on cognitive and physical development—has declined slower than in comparable countries, threatening the future of a generation.
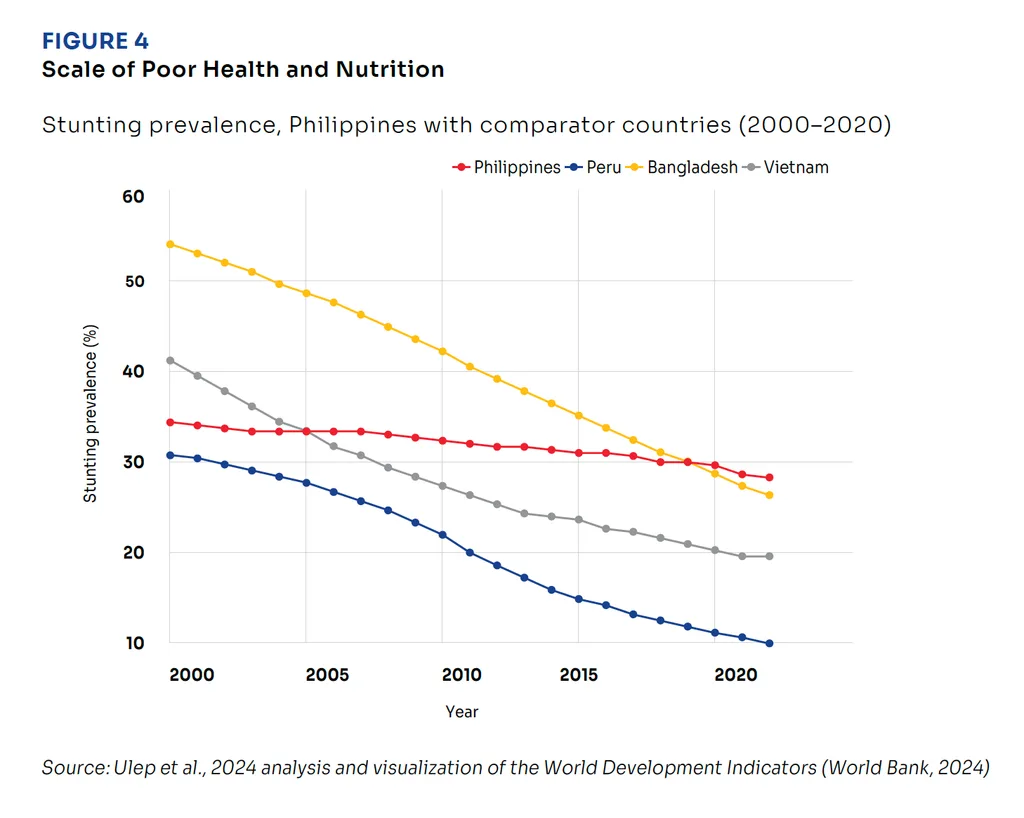
Source: Ulep et al., 2024 analysis and visualization of the World Development Indicators (World Bank, 2024)
Our Goal
To provide one hot, nutritious meal to stunted and malnourished school-aged children every school day.

By bringing them to a healthy weight, we help them develop their full cognitive potential, grow healthy bodies, and build a better future for themselves. We are committed to keeping children in the program for as long as their family is unable to provide adequate nutrition, ensuring a sustained impact on their well-being and education.
Our Scalable & Transformational Program
We've designed an efficient and effective model to maximize our impact.
School Partnerships
We partner with public schools to identify children most in need and to execute the daily feeding program seamlessly.
Quality Nutrition
We work with food commissaries to provide healthy, hygienic, and high-quality rice meals (rice, viand, vegetables, and fruit).
Health Monitoring
We constantly monitor the Body Mass Index (BMI) of children to track their progress and ensure they reach healthy levels.
Academic Performance
We follow up on academic results and support families to keep their children in formal education for a brighter future.
Low Cost, High Impact
Through partnerships and the help of volunteers we keep our costs low. A full meal costs just ₱100 (₱62 for food, ₱38 for logistics).
Child Centric Process
Our systems are designed for scalability and ease, ensuring that help reaches children without unnecessary delays.
Our Beneficiary
Putting our model into action.
Ilugin Elementary School
Pinagbuhatan, Pasig City
100
Children
200
School Days
5,460
Meals Served
as of October 9, 2026
Tracking Progress
Monitoring the health and growth of our beneficiaries every step of the way.
Absolute measurements (SY 2025–2026)
- In Grade 4 March 17, 2026 measurements, there was a slight error in the height as it was manually taken by the volunteers.
Average BMI
- Body mass index (BMI) is calculated based on the metric system. The weight in kilograms is divided by the height in meters, squared.
Grade Weighted Average from Q1 to Q4
Progress vs target
- The July measurements refer to the new target considering students are 1 year older.
BMI vs DepEd percentiles
- In these graphs, we can see DepEd's system with cut-offs that are aligned with Standard Deviations, which correspond directly to specific percentiles: Normal (Ideal Target): 15th to 85th percentile, Thinness/Wasted: 3rd to below 15th and Severely Thinness/Wasted: below 3rd percentile.
- In reference to the BMI for boys, on an average from July 2026, grades 4 and 5 are in the below 15th percentile which indicates that students are in wasted/thinness status compared to the ideal target.
- In reference to the BMI for girls, on an average from July 2025 and July 2026, grades 4 and 5 are in the below 15th percentile which indicates that students are in wasted/thinness compared to the ideal target.
BMI category mix
- We have not seen the average BMI improve as much as we expected because the increase in height has been greater than the increase in weight and BMI is a relation of weight vs height. However, over 80% of the students increased weight and over 95% increased height in absolute terms. We also saw that on average students did not increase weight during the summer when they do not receive meals from Feeding Futures PH.
- The grades of the students improved during the year, except for 3rd grade whose average stayed constant. This is particularly important, because this is one of the main goals of the program.
- We have also seen consistent gains versus the standard year over year in weight and especially in height: In July 2026, the average height came close to the standard for 3rd and 4th grade. We have a total of 27 out of 43 (63% of total) students who improved their height against the standard, 22 out of 43 (51 % of total) students who improved their weight against the standard and 16 out of 43 (37% of total) who improved their BMI (we are using as comparison only 43 students because those are the ones that will continue with the program. Out of the 60 students that we had last year, 17 will be enrolled in a DepEd feeding program).
Attendance
| Month | Students Present | Target Attendance | % |
|---|---|---|---|
| July 2025 | 389 | 420 | 93% |
| August 2025 | 958 | 1,020 | 94% |
| September 2025 | 1,173 | 1,200 | 98% |
| October 2025 | 653 | 660 | 99% |
| November 2025 | 967 | 1,020 | 95% |
| December 2025 | 696 | 780 | 89% |
| January 2026 | 963 | 1,122 | 86% |
| February 2026 | 939 | 1,102 | 85% |
| March 2026 | 805 | 870 | 93% |
| Total | 7,543 | 8,194 | 92% |
- The data reflects an overall average attendance rate of 92%.
- This data is gathered as of March 24, 2026.
- Target attendance means the total feeding days based on actual school days in a month times the number of beneficiaries who were given meals.
Action plans
- Adjust Caloric & Protein Intake: Consult with a nutritionist to balance the growth in weight with the growth in height. We are already adding 20 grams of protein more than last year (70 grams instead of 50).
- Nutritional Education & Home Engagement: Work with parents to improve diet quality at home during non-school hours, weekends, holidays and summer break.
- Personal attention: We will follow the data of each student to intervene individually, according to their specific needs.
FROM THE BLOG
Kicking Off Another Year of Hope
Feeding Futures PH welcomes School Year 2026–2027 by growing from 60 to 100 children in Grades 2 to 5. Read how this community is opening another chapter of nourishment, learning, and hope.
How can you help?
Choose from any of the donor packages to become a
Pathway Provider
₱20,000
Give a meal to a child for 200 days (1 school year)
Steady Sustainer
₱10,000
Give a meal to a child for 100 days (half a school year)
Growth Guardian
₱3,000
Give a meal to a child for 30 days
Daily Donor
₱100
Give a meal to a child for 1 day
Be Part of the Solution.
We are seeking corporate partners to help us sustain and expand our program. We can streamline donations from your customers and employees, inspired by successful models like Spain's "Un Kilo De Ayuda". Join us in creating a lasting impact.